Embedded AI accelerators gain advanced debugging support in UDE 2026
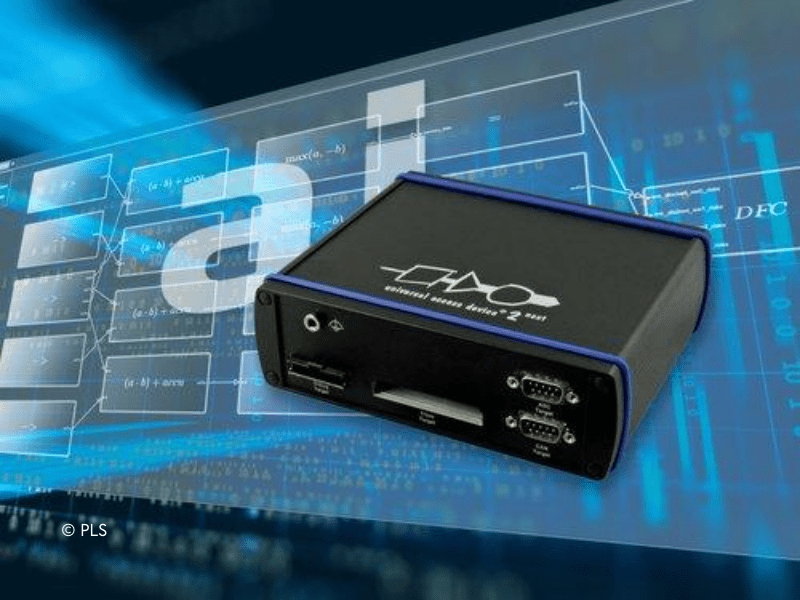
As embedded AI workloads move from research into production silicon, development tools are having to keep pace. PLS has updated its Universal Debug Engine to address the specific challenges posed by highly parallel, data flow-based accelerators integrated into microcontrollers and SoCs.
For eeNews Europe readers working on AI-enabled automotive and industrial designs, the ability to analyse and validate accelerator behaviour at runtime is becoming increasingly relevant. Debug visibility at system level can be critical when integrating dedicated AI hardware and embedded AI accelerators alongside conventional CPU cores.
Debugging data flow architectures
The latest UDE 2026 release extends debug, trace and test capabilities to cover special data flow-oriented algorithms used in embedded AI applications. In practice, this means developers can now apply advanced analysis techniques to embedded AI accelerators based on data flow architectures.
Unlike instruction-based processors, DFA implements algorithms as interconnected mathematical base blocks arranged in a native data flow graph. This approach can potentially offer higher efficiency in terms of silicon area and power consumption, making it suitable for integration into embedded systems and SoCs targeting AI workloads.
However, such graph-based execution models cannot be analysed using conventional debugger functions alone. PLS has therefore expanded UDE with dedicated features to analyse and debug the DFA data flow graph.
System-level visibility and runtime analysis
Within an embedded system, the DFA accelerator can be started and stopped either independently or synchronously with the host controller cores. In UDE, it appears as an additional core within a run control group, enabling synchronised debugging across main cores and the accelerator.
This setup allows parallel debugging of the application software running on the main cores while observing the accelerator behaviour. Single-stepping makes it possible to examine data flow in detail and verify or modify the configuration of individual base blocks.
The data flow graph itself is visualised graphically, for example as a tree or block diagram, with different display formats that developers can adapt to their needs. Import and export functions for DFA configurations are also included.
For runtime analysis, a SystemC simulation model can record DFA runtime data. An additional software component decodes and displays this data both as text and as a time-correlated graphical representation.
The additional test and analysis functions are available for first automotive microcontrollers implementing DFA as well as for virtual prototyping using the DFA simulation model.
 If you enjoyed this article, you will like the following ones: don't miss them by subscribing to :